The
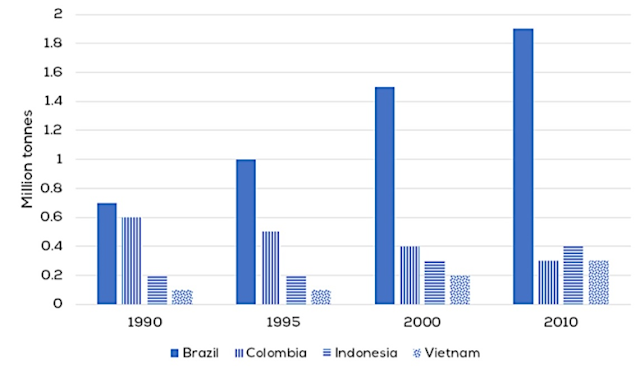
graph gives information about coffee production in 4 different countries from
1990 to 2010.
Đoạn
1: Miêu tả số liệu của Brazil và Indonesia (cùng tăng)
Ø Năm
1990, Brazil sản xuất 0.7 triệu tấn cà phê, so với chỉ có 0.2 triệu tấn ở
Indonesia.
Ø 20
năm sau, sản lượng của Brazil tăng vọt và đạt 1.9 triệu tấn trong khi sản lượng
của Indonesia cũng tăng nhưng ở mức thấp hơn – đạt 0.4 triệu tấn.
BODY
1.
Ø Brazil
produced 0.7 million tonnes of coffee in 1990, compared to just 0.2 million
tonnes produced by Indonesia.
Ø 20
years later, the production in Brazil nearly tripled and reached 1.9 million
tonnes – still holding the highest position among the surveyed countries.
Ø The
figure for Indonesia also increased but at a lower degree (to just 0.4 million
tonnes in 2010).
Đoạn
2: Miêu tả số liệu của Vietnam và Columbia (số liệu năm cuối bằng nhau)
Ø Năm
1990, sản lượng cà phê của Columbia gấp 6 lần của Vietnam.
Ø Sau
đó, số liệu của Vietnam tăng đều trong khi số liệu của Columbia có xu hướng ngược
lại. Số liệu của 2 nước bằng nhau vào năm 2010.
BODY
2
Ø Regarding
the other two countries, the coffee production of Columbia in 1990 was three
times higher than that of Vietnam (0.6 million tonnes compared to about 0.1
million tonnes).
Ø However,
the two figures saw opposite trends in the following 20 years – the production
in Columbia saw a twofold decrease while the figure for Vietnam tripled.
Ø In
2010, the amounts of coffee produced in both countries were equal, at 0.3
million tonnes.


0 Nhận xét